Continuation of Part 3
STEP 8: ADD CONTROL POINTS AND CREATE THE CURVES
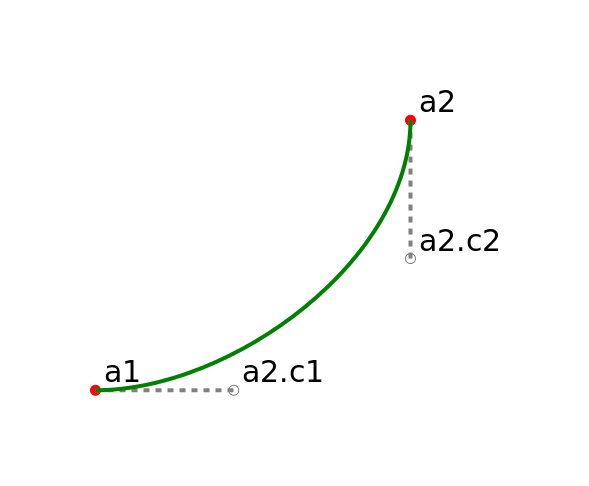
Curves are stored in SVG files as bezier curves. Bezier curves in Tau Meta Tau Physica are defined with 4 points: a start point, two control points and an end point. If you use Inkscape to look at a curve in any SVG drawing, you’ll notice that there are control handle lines extending from each point on the curve. The end of a point’s handle line is the control point for that point.
If we have a curve a1-a2, we can begin estimating the length of the control handles as one-third the distance between a1 and a2.
length=distance(a1,a2)/3.0
a1=patternPointXY(A,’a1′,3*IN,0.0)
a2=patternPointXY(A,’a2′,2.0*IN,5*IN)
length=distance(a1,a2)/3.0
a2.c1=controlPoint(A,’a2.c1′,rightPoint(a1,length)) a2.c2=controlPoint(A,’a2.c2′,downPoint(a2,length))
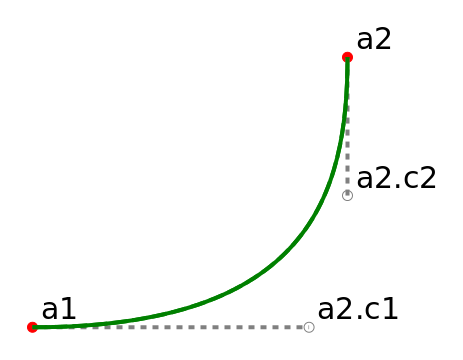
If we want to change the curvature, then we can change the length and/or the angle of the curve. Move the control point a2.c1 farther away from a1 to make the first control point a2.c1 pull a bit stronger on the curve.
a2.c1=controlPoint(A,’a2.c1′,rightPoint(a1,2*length))
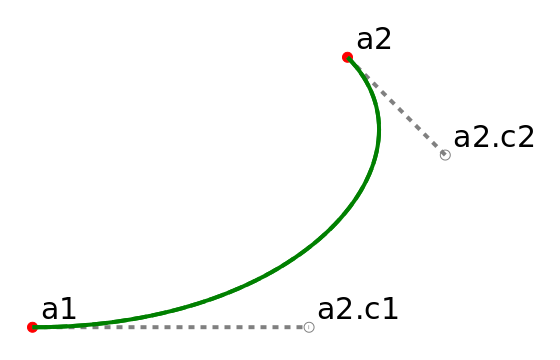
We can also change the angle of the control handle line. Calculate the second control point at 45 degrees from a2 and the curve is ‘pulled’ out towards a2.c2. To find a point using degrees, use polarPoint(start_point, distance, radians). To convert radians from degrees use angleOfDegree(degree).
a2.c2=controlPoint(A,’a2.c2′,polarPoint(a2,length1,angleOfDegree(45)))
One method for achieving a ‘fair’ curve using three points is to choose the control points around the middle point, then aim the start and end control points at the middle control points.
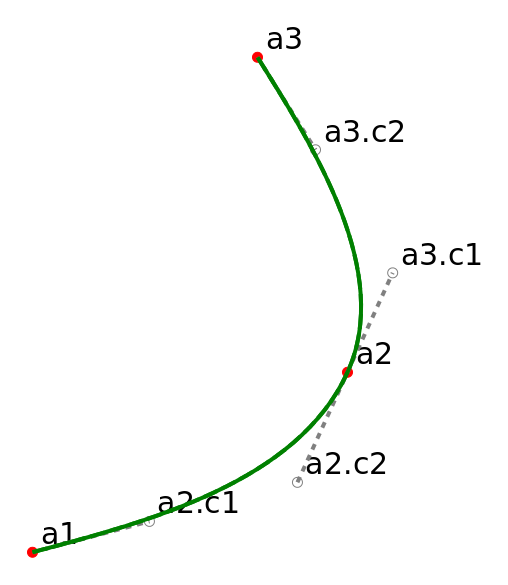
For a curve from a1 to a3 with the curve’s deepest point at a2, the control points around a2 are on a line parallel to the line from a1 to a3.
First get the distances between a1 & a2 and a2 & a3. Then get the angle from a1-a3 and from a3 back to a1. Use these angles to create the control points around a2 (a2.c2 and a3.c1).
length1=distance(a1,a2)/3.0
length2=distance(a2,a3)/3.0
angle1=angle1OfLine(a3,a1)
a2.c2=controlPoint(A,’a2.c2′, polarPoint(a2,length1,angle1) )
angle2=angleOfLine(a1,a3)
a3.c1=controlPoint(A,’a3.c1′, polarPoint(a2,length2,angle2) )
Create a2.c1 with the angle from a1 to a2.c2:
angle3=angleOfLine(a1,a2.c2)
a2.c1=controlPoint(A,’a2.c1′,polarPoint(a1,length1,angle3))
Create a3.c2 with the angle from a3 to a3.c1.
angle4=angleOfLine(a3,a3.c1)
a3.c2=controlPoint(A,’a3.c2′,polarPoint(a3,length2,angle4))
Here is a three point curve which has control point a2.c1 to the right of a1:
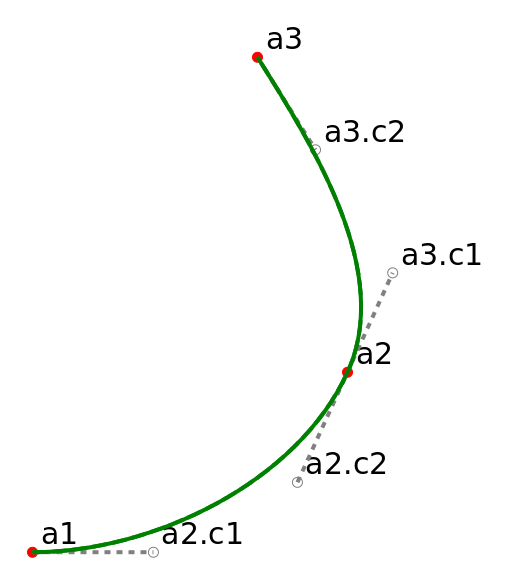
a1.c1=controlPoint(A,’a1.c1,rightPoint(a1,length1))
This last example shows a2.c2 and a3.c1 on an angle halfway between a vertical line and the angle of a1-a3:
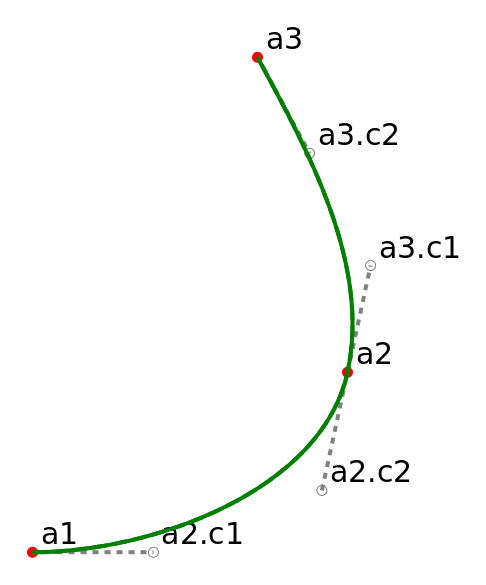
length1=distance(a1,a2)/3.0
length2=distance(a2,a3)/3.0
ANGLE90=angleOfDegree(90)
ANGLE180=angleOfDegree(180)
angle1=(ANGLE90+angleOfLine(a3,a1))/2.0
a2.c2=controlPoint(A,’a2.c2′,polarPoint(a2,length1,angle1))
angle2=angle1-ANGLE180
a3.c1=controlPoint(A,’a3.c1′,polarPoint(a2,length2,angle2))
a2.c1=controlPoint(A,’a2.c1′,rightPoint(a1,length1))
angle4=angleOfLine(a3,a3.c1)
a3.c2=controlPoint(A,’a3.c2′,polarPoint(a3,length2,angle4))
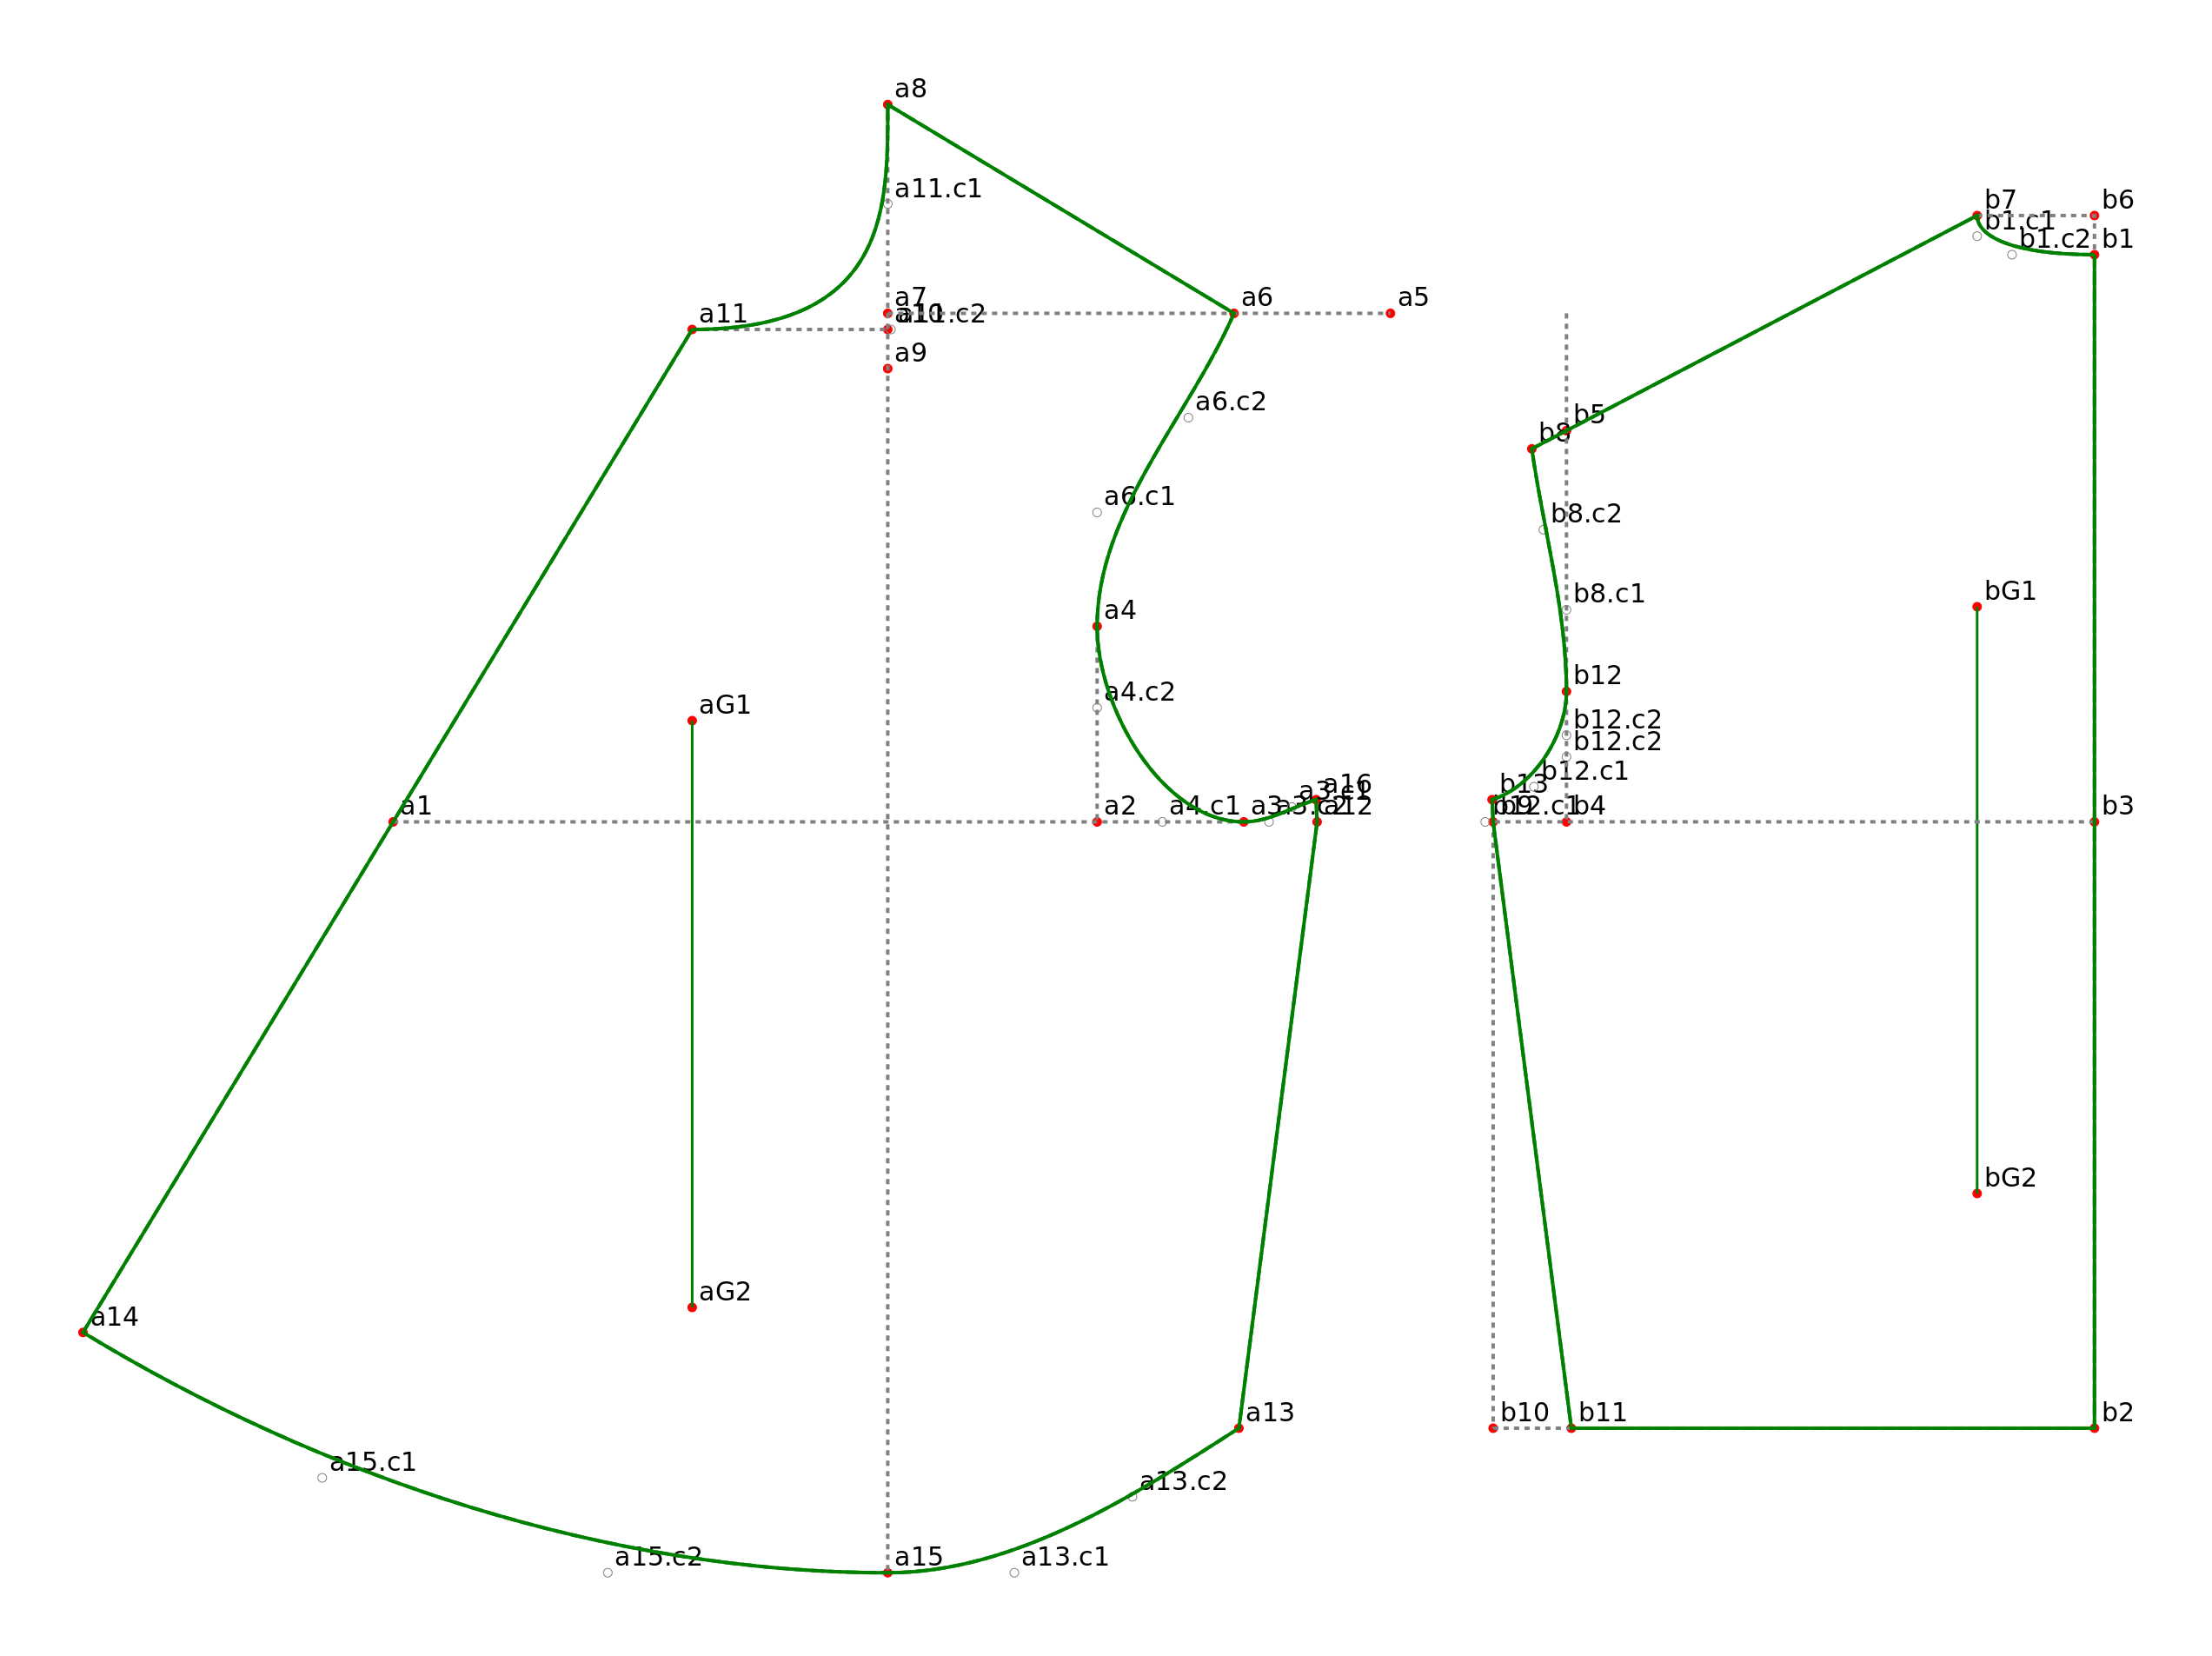
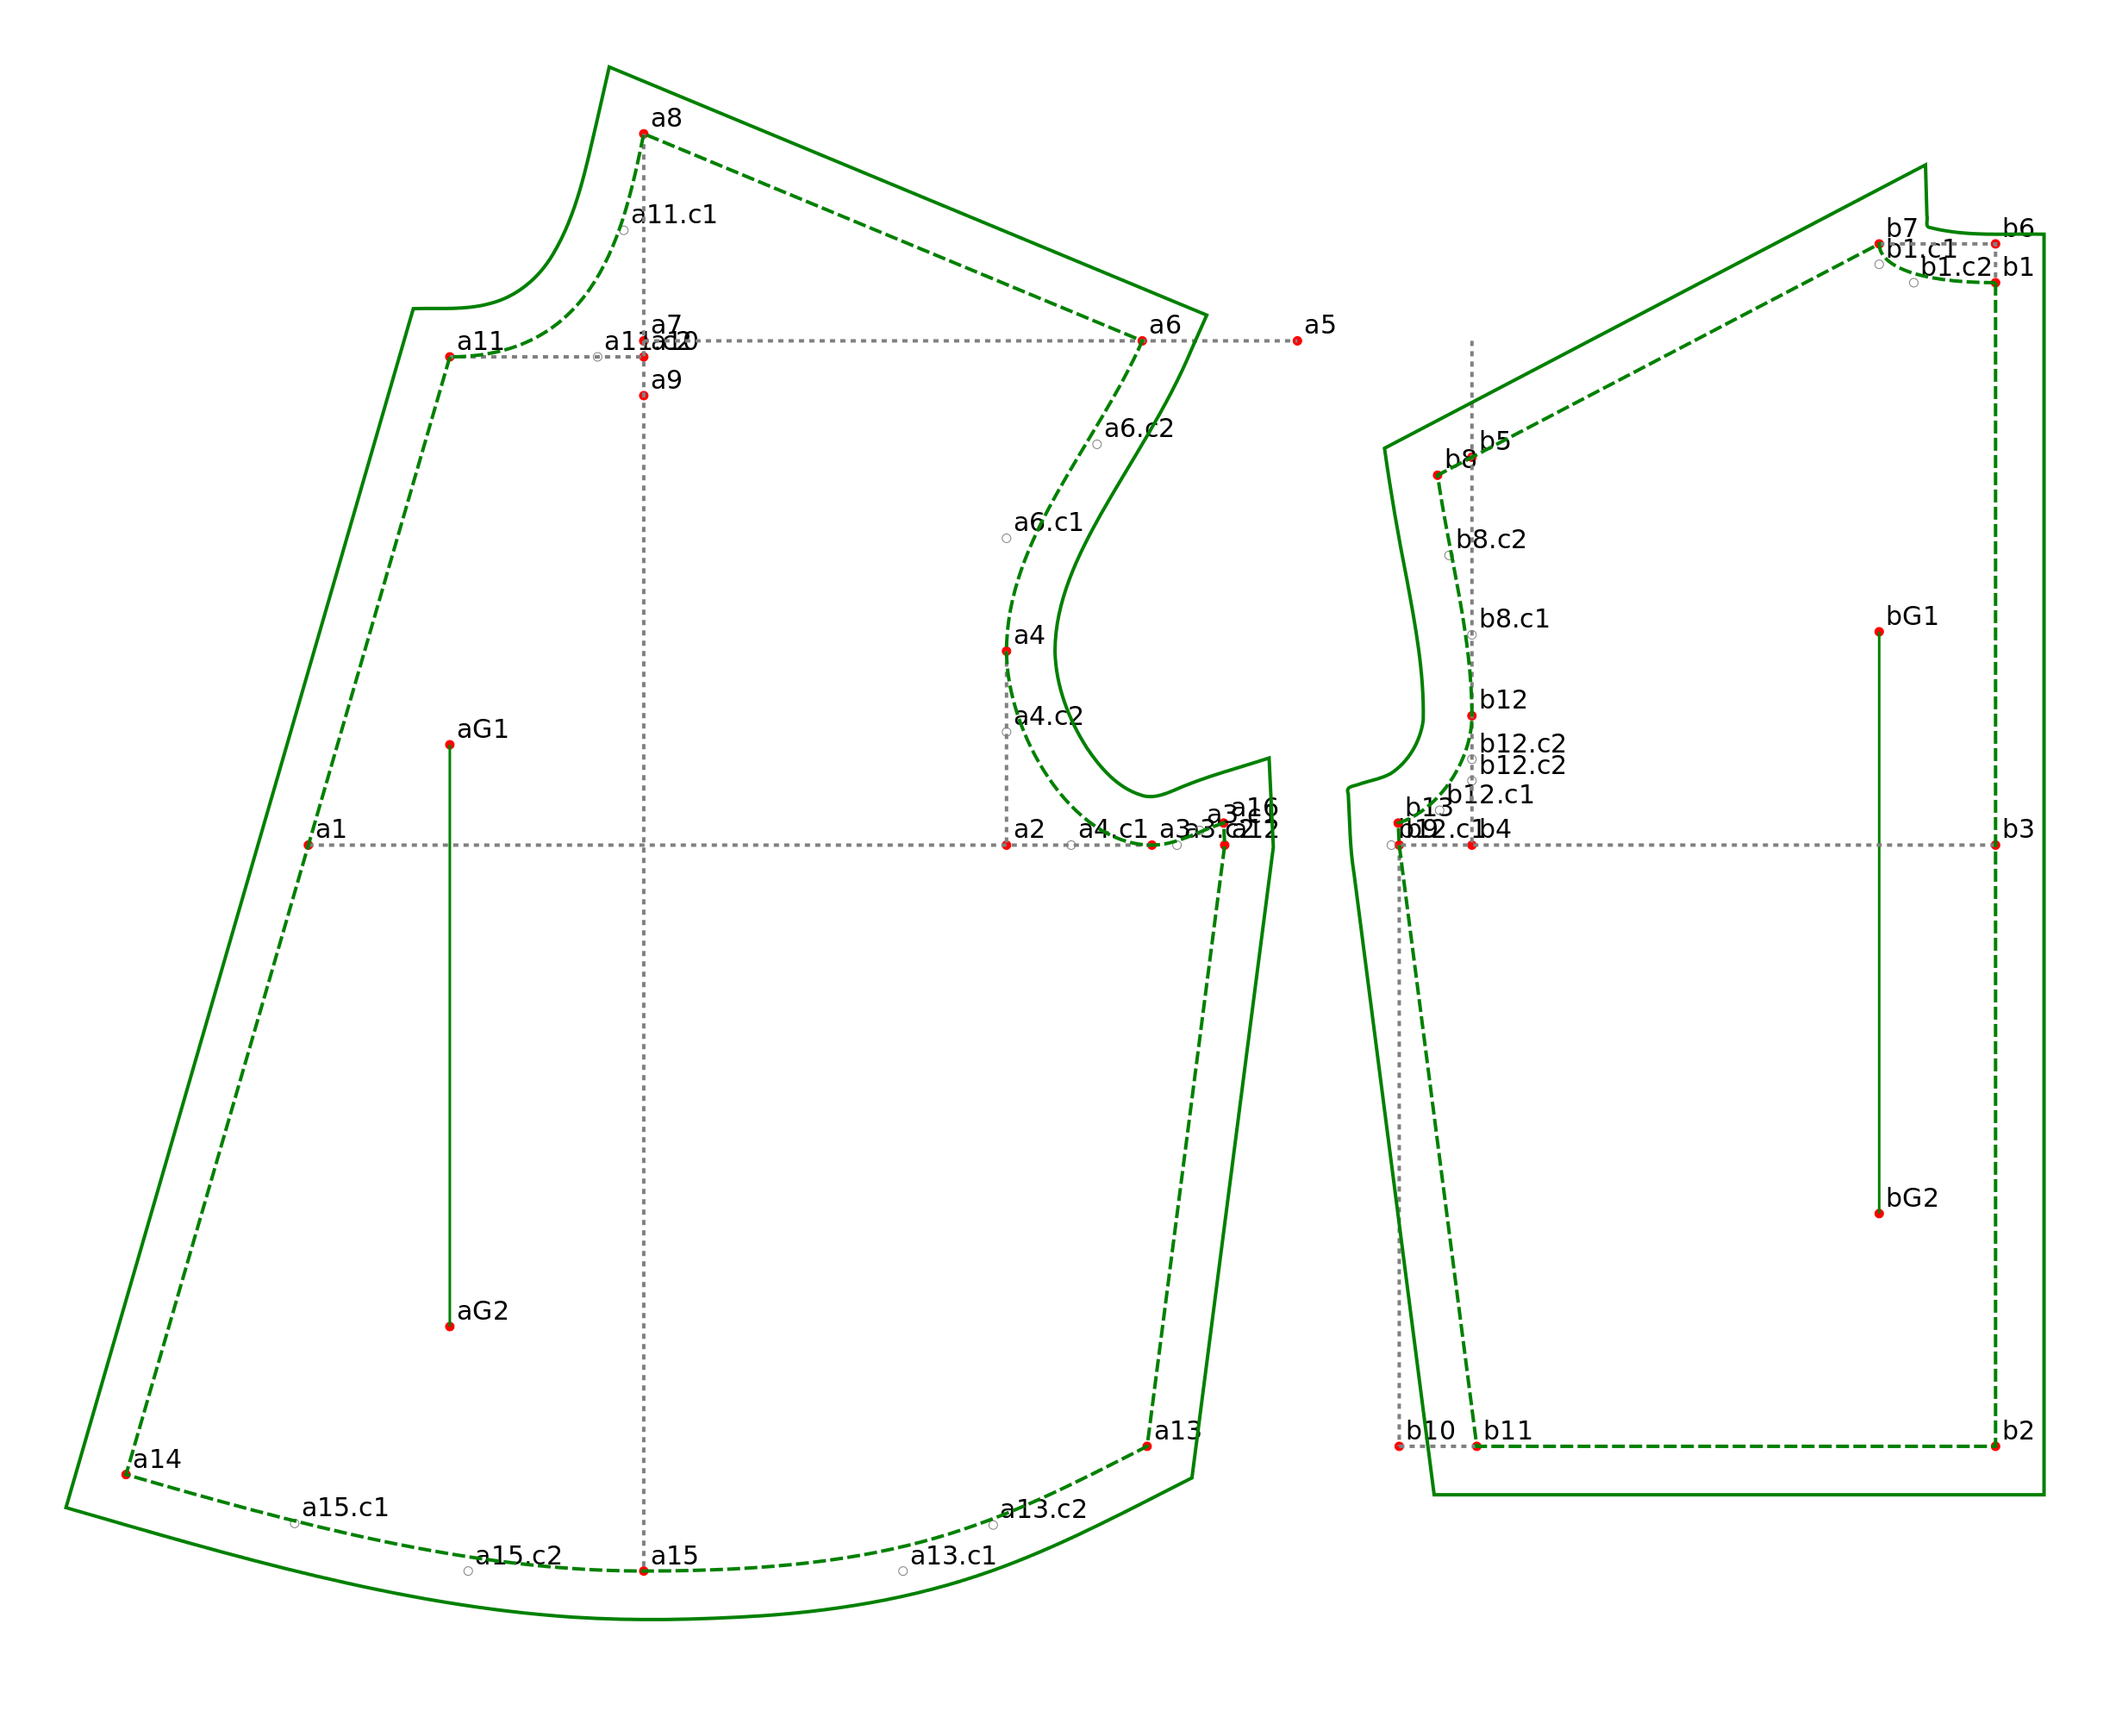
When I added curves to the pattern, this was the result:
The neck and the waist curves don’t look like the drawing in the book. I had made a change to the formula and created a7 by measuring from a6 (point M) instead of a5 (point N), as it would create the front shoulder a6-a8 longer than back shoulder b8-b7. When I changed a7’s formula to use to a5 the neck was corrected. As a result there is ease (0.6 inch) in the front shoulder. I played with the angle of a11.c2 and the length of a11.c2 until the neck looked similar to the drawing. Then I increased the length for calculating a13.c1 so that the waist curve from a15 to a13 looks more smooth.
Here is the final result. Download files from here. Run the extension from Inkscape/Extensions/Sewing Patterns/2 Shirt Waist. To create seam allowances select the solid outline of the front & back and press Ctrl-). To remove the points and their labels, save your original file, press Ctrl-F and enter ‘reference’ in the the Attribute field. Click on the Find button, then press Delete and save as a PDF. Use Posterizer or other program to break the PDF into sections if needed. Use Evince, Okular or other document viewer to send the PDF file to your printer or plotter. Best practice is to print or plot from the ‘Print Preview’ option at 300DPI.
You must be logged in to post a comment.